We should try this for Health App Dashboards (Redesigning Withings App)
Most health dashboards act like passive measurement rulers. By rethinking glanceability, brand micro-visuals, and proactive intelligence, dashboards can become active personal advisors.
A strategic UX redesign exercise exploring how health dashboards can move from passive number logging to actionable, glanceable intelligence.
1. Strategy Over Surface: Getting the Objective
I used to judge an application screen purely by visual styling—its color palette, drop shadows, and typography. But evaluating UI through surface aesthetics alone lacks strategic direction. Over years of designing commercial products, I built a three-question diagnostic framework that guides every redesign:
Implication: What is the core narrative this screen is communicating to the user?
Task Objective: How does the interface guide the user toward their primary daily action?
Assumed Identity: How does the screen make the user feel, and what persona does the product project?
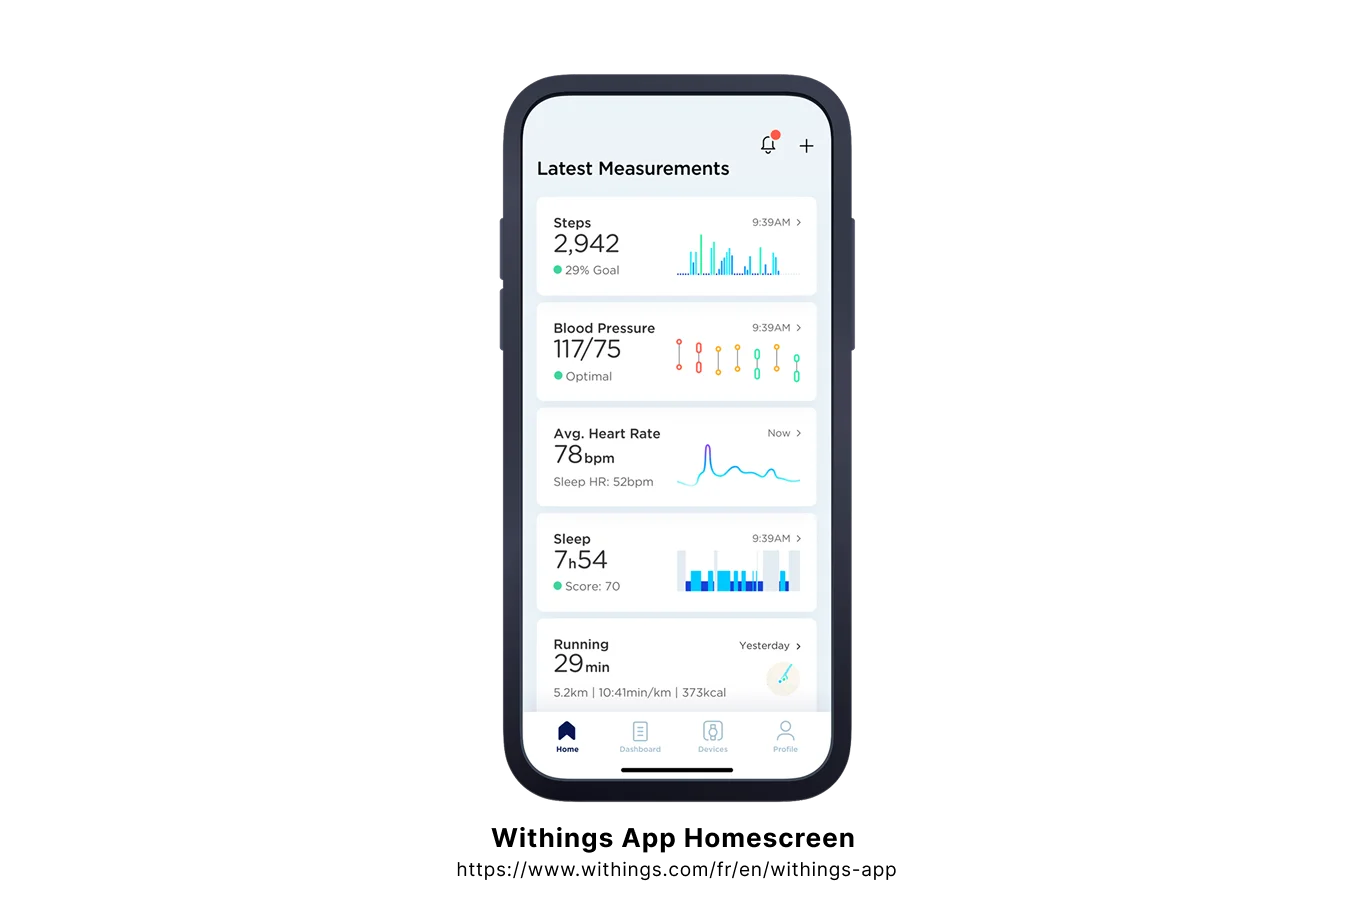
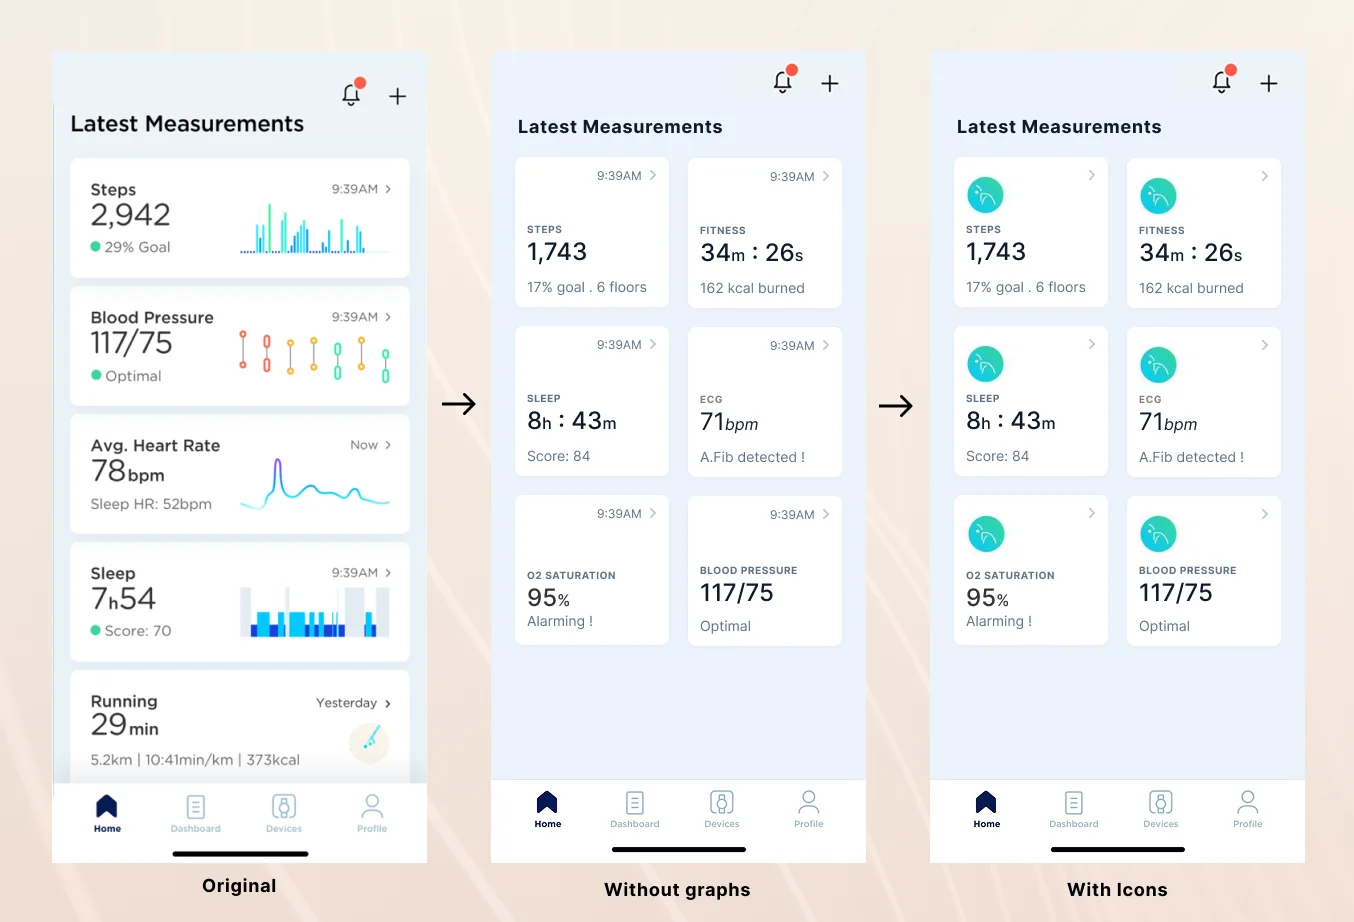
Figure 1.0: The original Withings homescreen layout. Clean and functional, but prone to vertical comparison fatigue.
When inspecting the original Withings homescreen, four distinct product friction points emerged:
01Attention Diffusion: With stacked full-width cards, the user must expend significant cognitive effort scrolling and reading each tile individually.
02Subconscious Comparison: A vertical list view subconsciously prompts users to compare metrics against adjacent cards above and below, even when the data points are medically unrelated.
03Passive Telemetry: The screen reports raw data overviews, but fails to tell the user what tangible health action they should take next.
04Graph Utility: The tiny embedded sparklines were visually compressed, making precise trend interpretation difficult on mobile screens.
2. From List View to Compact Grid
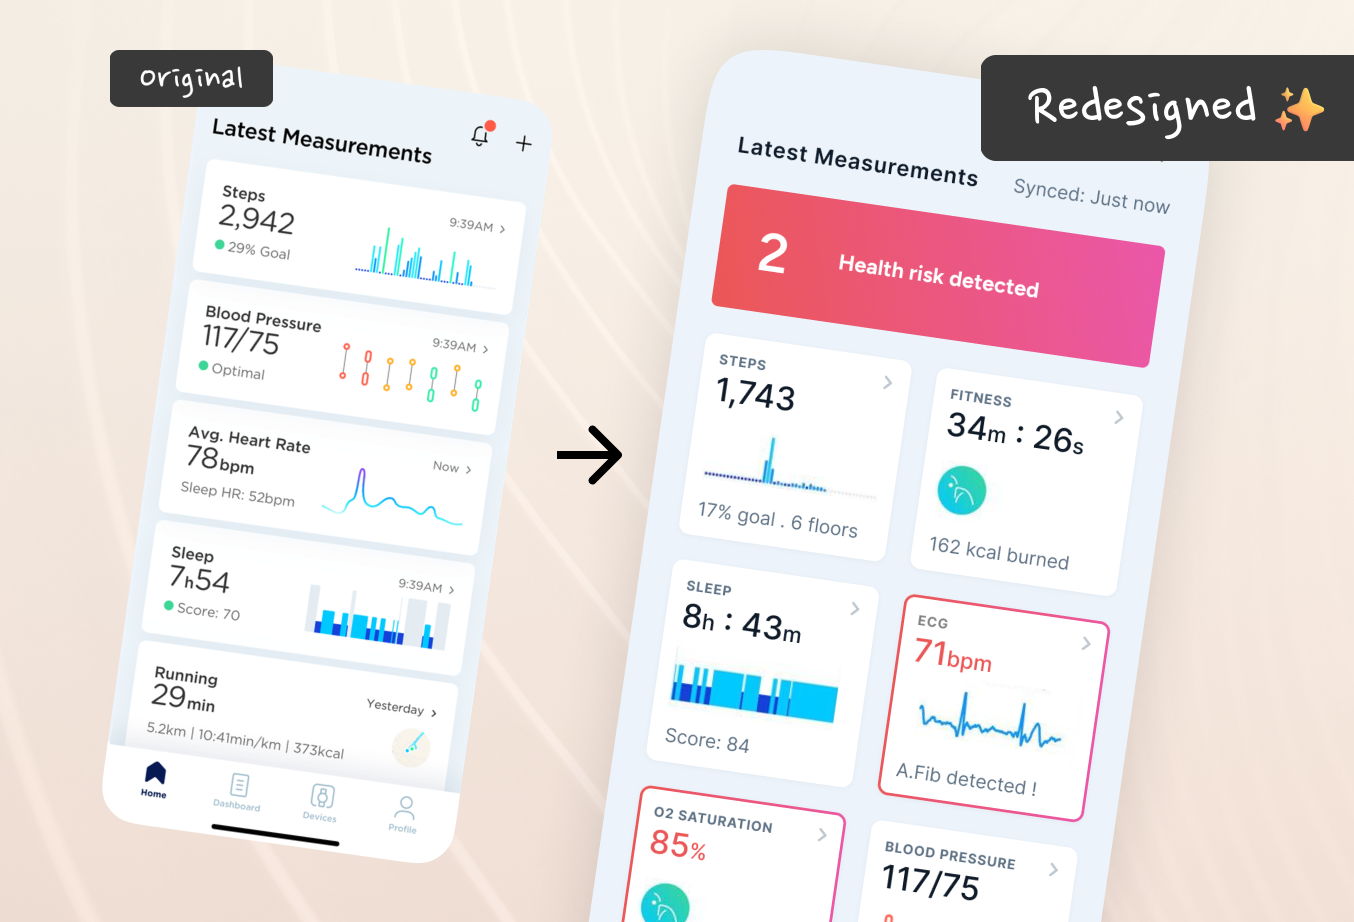
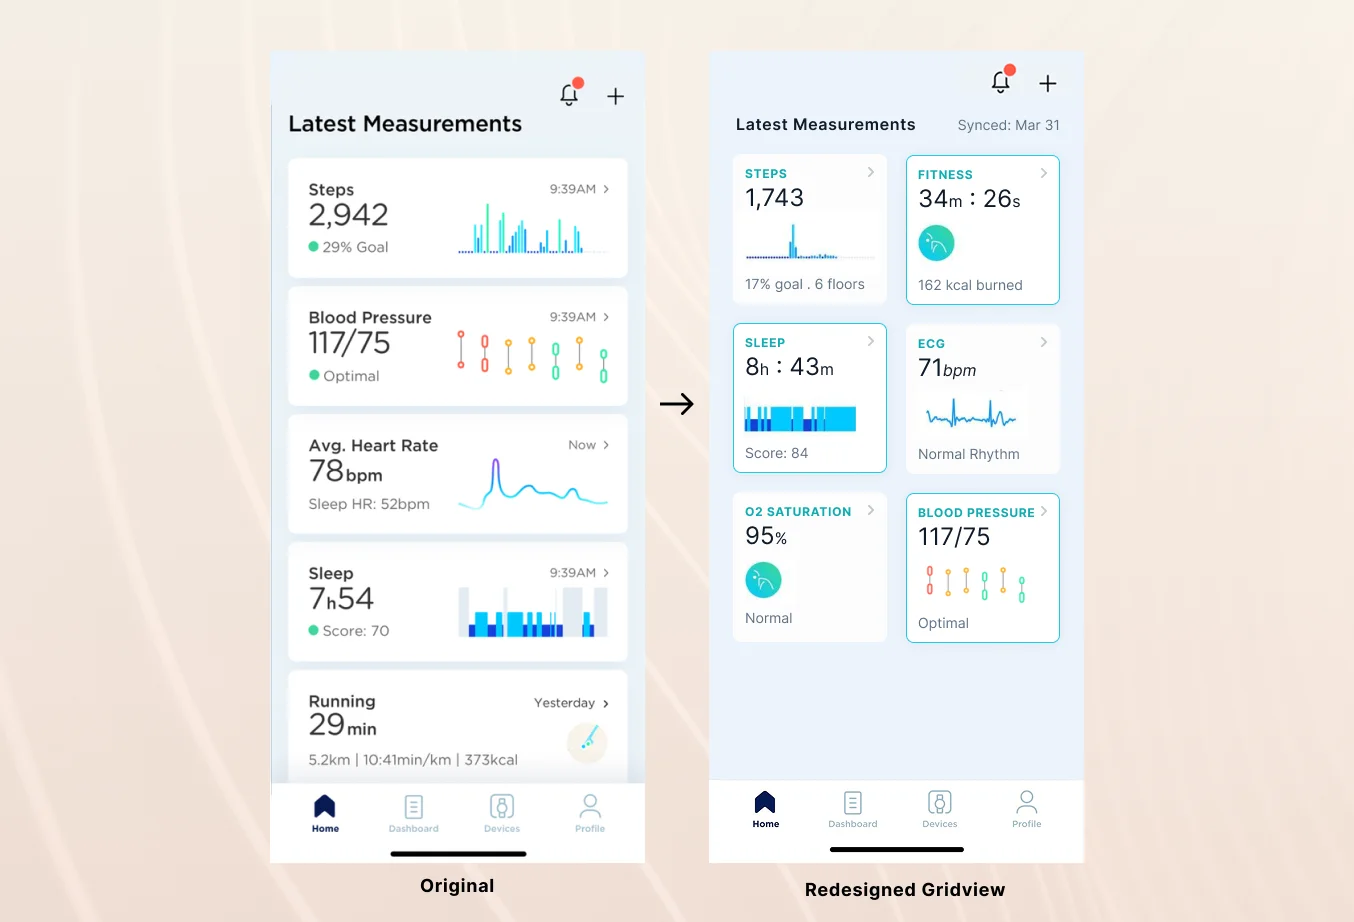
My primary hypothesis was that health metrics are most actionable when consumed at a single glance. By shifting from a vertical stacked list to a 2-column modular grid, we can pack essential vitals into the initial viewport without requiring constant scrolling.
Figure 2.0: Transitioning from a single-column list to a dual-column modular grid to optimize vertical glanceability.
Condensing that much information into half-width cards initially created typographic clutter: eyebrow titles, primary numbers, measurement units, timestamps, and trend graphs all fought for visual hierarchy. Through iterative refinement, I established a strict information sequence:
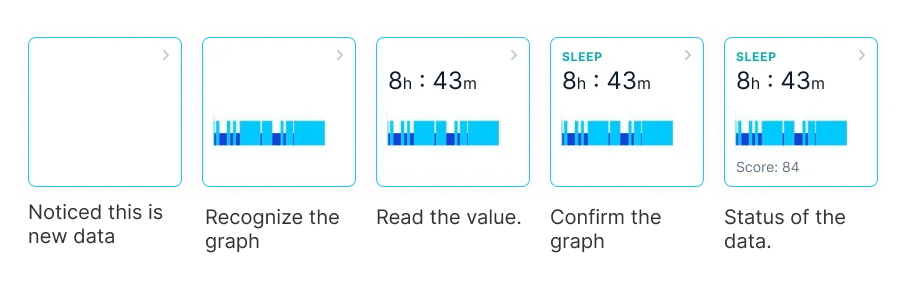
Figure 3.0: Information hierarchy iteration—prioritizing glanceable numbers and sparkline identity over secondary labels.
Secondary Eyebrows: Because the mini-graph immediately identifies the data category, eyebrow labels receive muted, secondary typographic treatment.
Familiar Units: Users already know blood pressure is measured in mmHg and heart rate in BPM. Units are de-emphasized to let primary digits dominate.
Restoring the Micro-Graphs: I initially experimented with replacing graphs with simple monochrome icons. It was a mistake. Icons stripped away the app’s visual identity. Withings looks like Withings specifically because of those meticulous mini-sparklines. I brought them back immediately.
Timestamp Noise Reduction: Removed explicit “last synced 2h ago” text. Instead, borrowed status indicators from modern messaging apps—subtle dot indicators for unreviewed data.
Figure 4.0: The refined grid view in practice—high data density with zero visual chaos.
Why Micro-Visuals Represent Brand Equity
Designers frequently fall into the trap of over-simplifying interfaces down to generic component kits. But proprietary visual elements—like Withings’ bespoke sparkline curves—are not decorative fluff; they are the recognizable fingerprint of the product. When you strip them away in the name of “minimalism”, you strip away the user’s emotional attachment and brand recognition.
3. The Gym Trainer Rule: Proactive Insights
Even with an optimized grid layout, one fundamental problem remained: the dashboard was still a passive mirror. It told the user what their metrics were, but gave zero insight into what those numbers meant.
Imagine you work with a personal gym trainer. Every morning, you ask: “How am I doing?” If your trainer simply read back your raw numbers—“Weight 74.2 kg, Sleep 7.1 hours, Blood Pressure 122/80”—you would find them useless.
A real trainer synthesizes the data: “Your recovery was fantastic after yesterday’s workout, but your blood oxygen has dipped for three consecutive nights—let’s check your bedroom ventilation.”
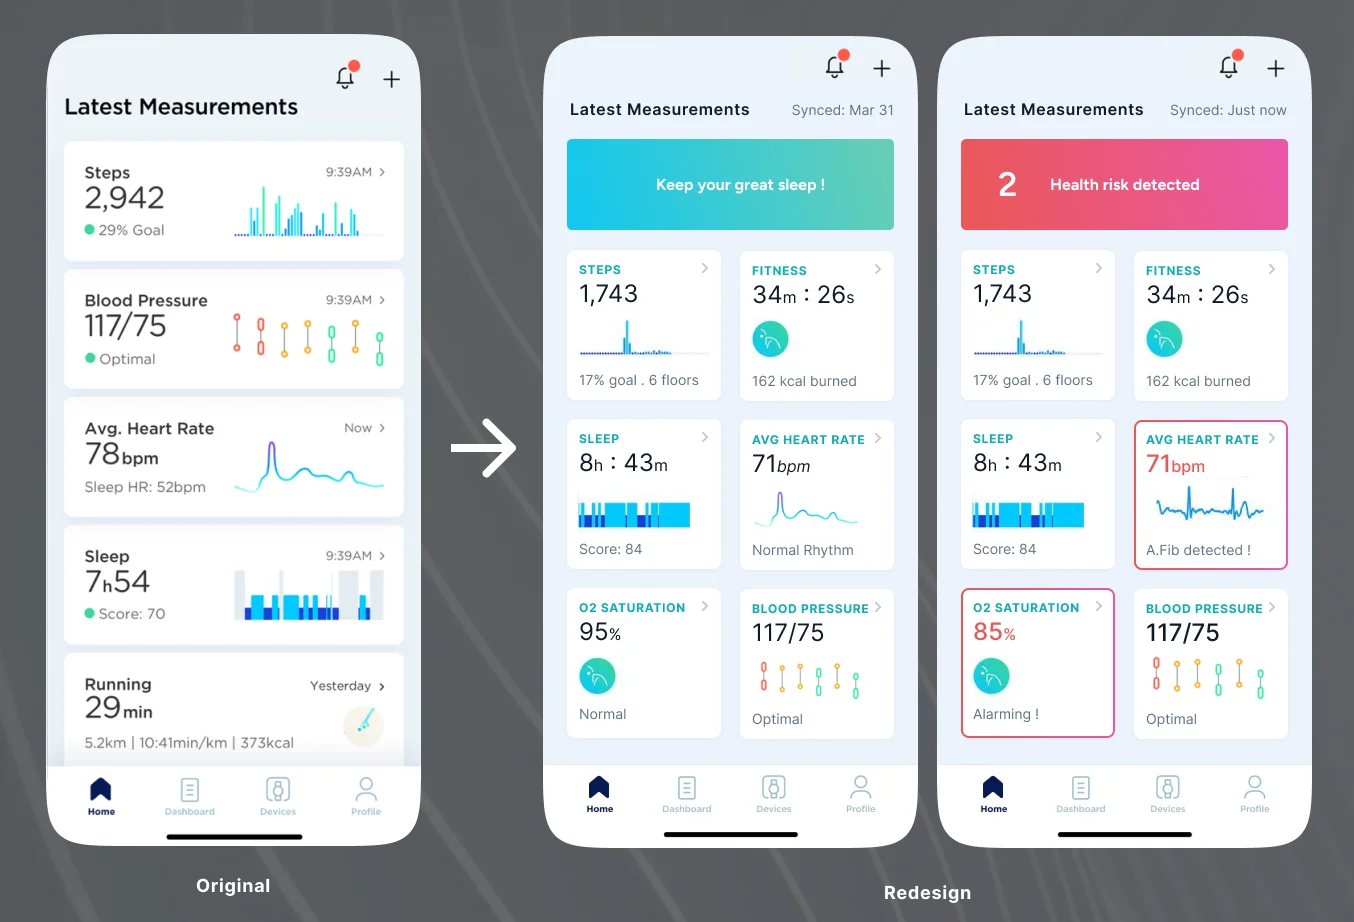
Figure 5.0: The final redesigned dashboard. Proactive analysis highlights celebrate wins and flag persistent anomalies before presenting the metric grid.
That insight led to the headline component of the redesign: The Proactive Health Summary. Positioned at the very top of the dashboard, it interprets combined health trends, highlights positive milestones, and flags anomalies requiring attention before the user even looks at individual tiles.
A good dashboard gives you data. A great dashboard gives you understanding. When designing for human health, software should act as a proactive advisor, not a passive digital spreadsheet.
— Presto — Product Designer & Strategist
4. Core Lessons Learned
Key Takeaways from the Redesign Sprint
Design Dimension
Common Mistake
Senior UX Standard
Brand Visuals
Replacing unique sparklines with generic icon glyphs.
Preserve and elevate signature brand micro-visuals.